Protein properties of E.coli K-12: Foldome analysis
Most common folds in E.coli K-12:
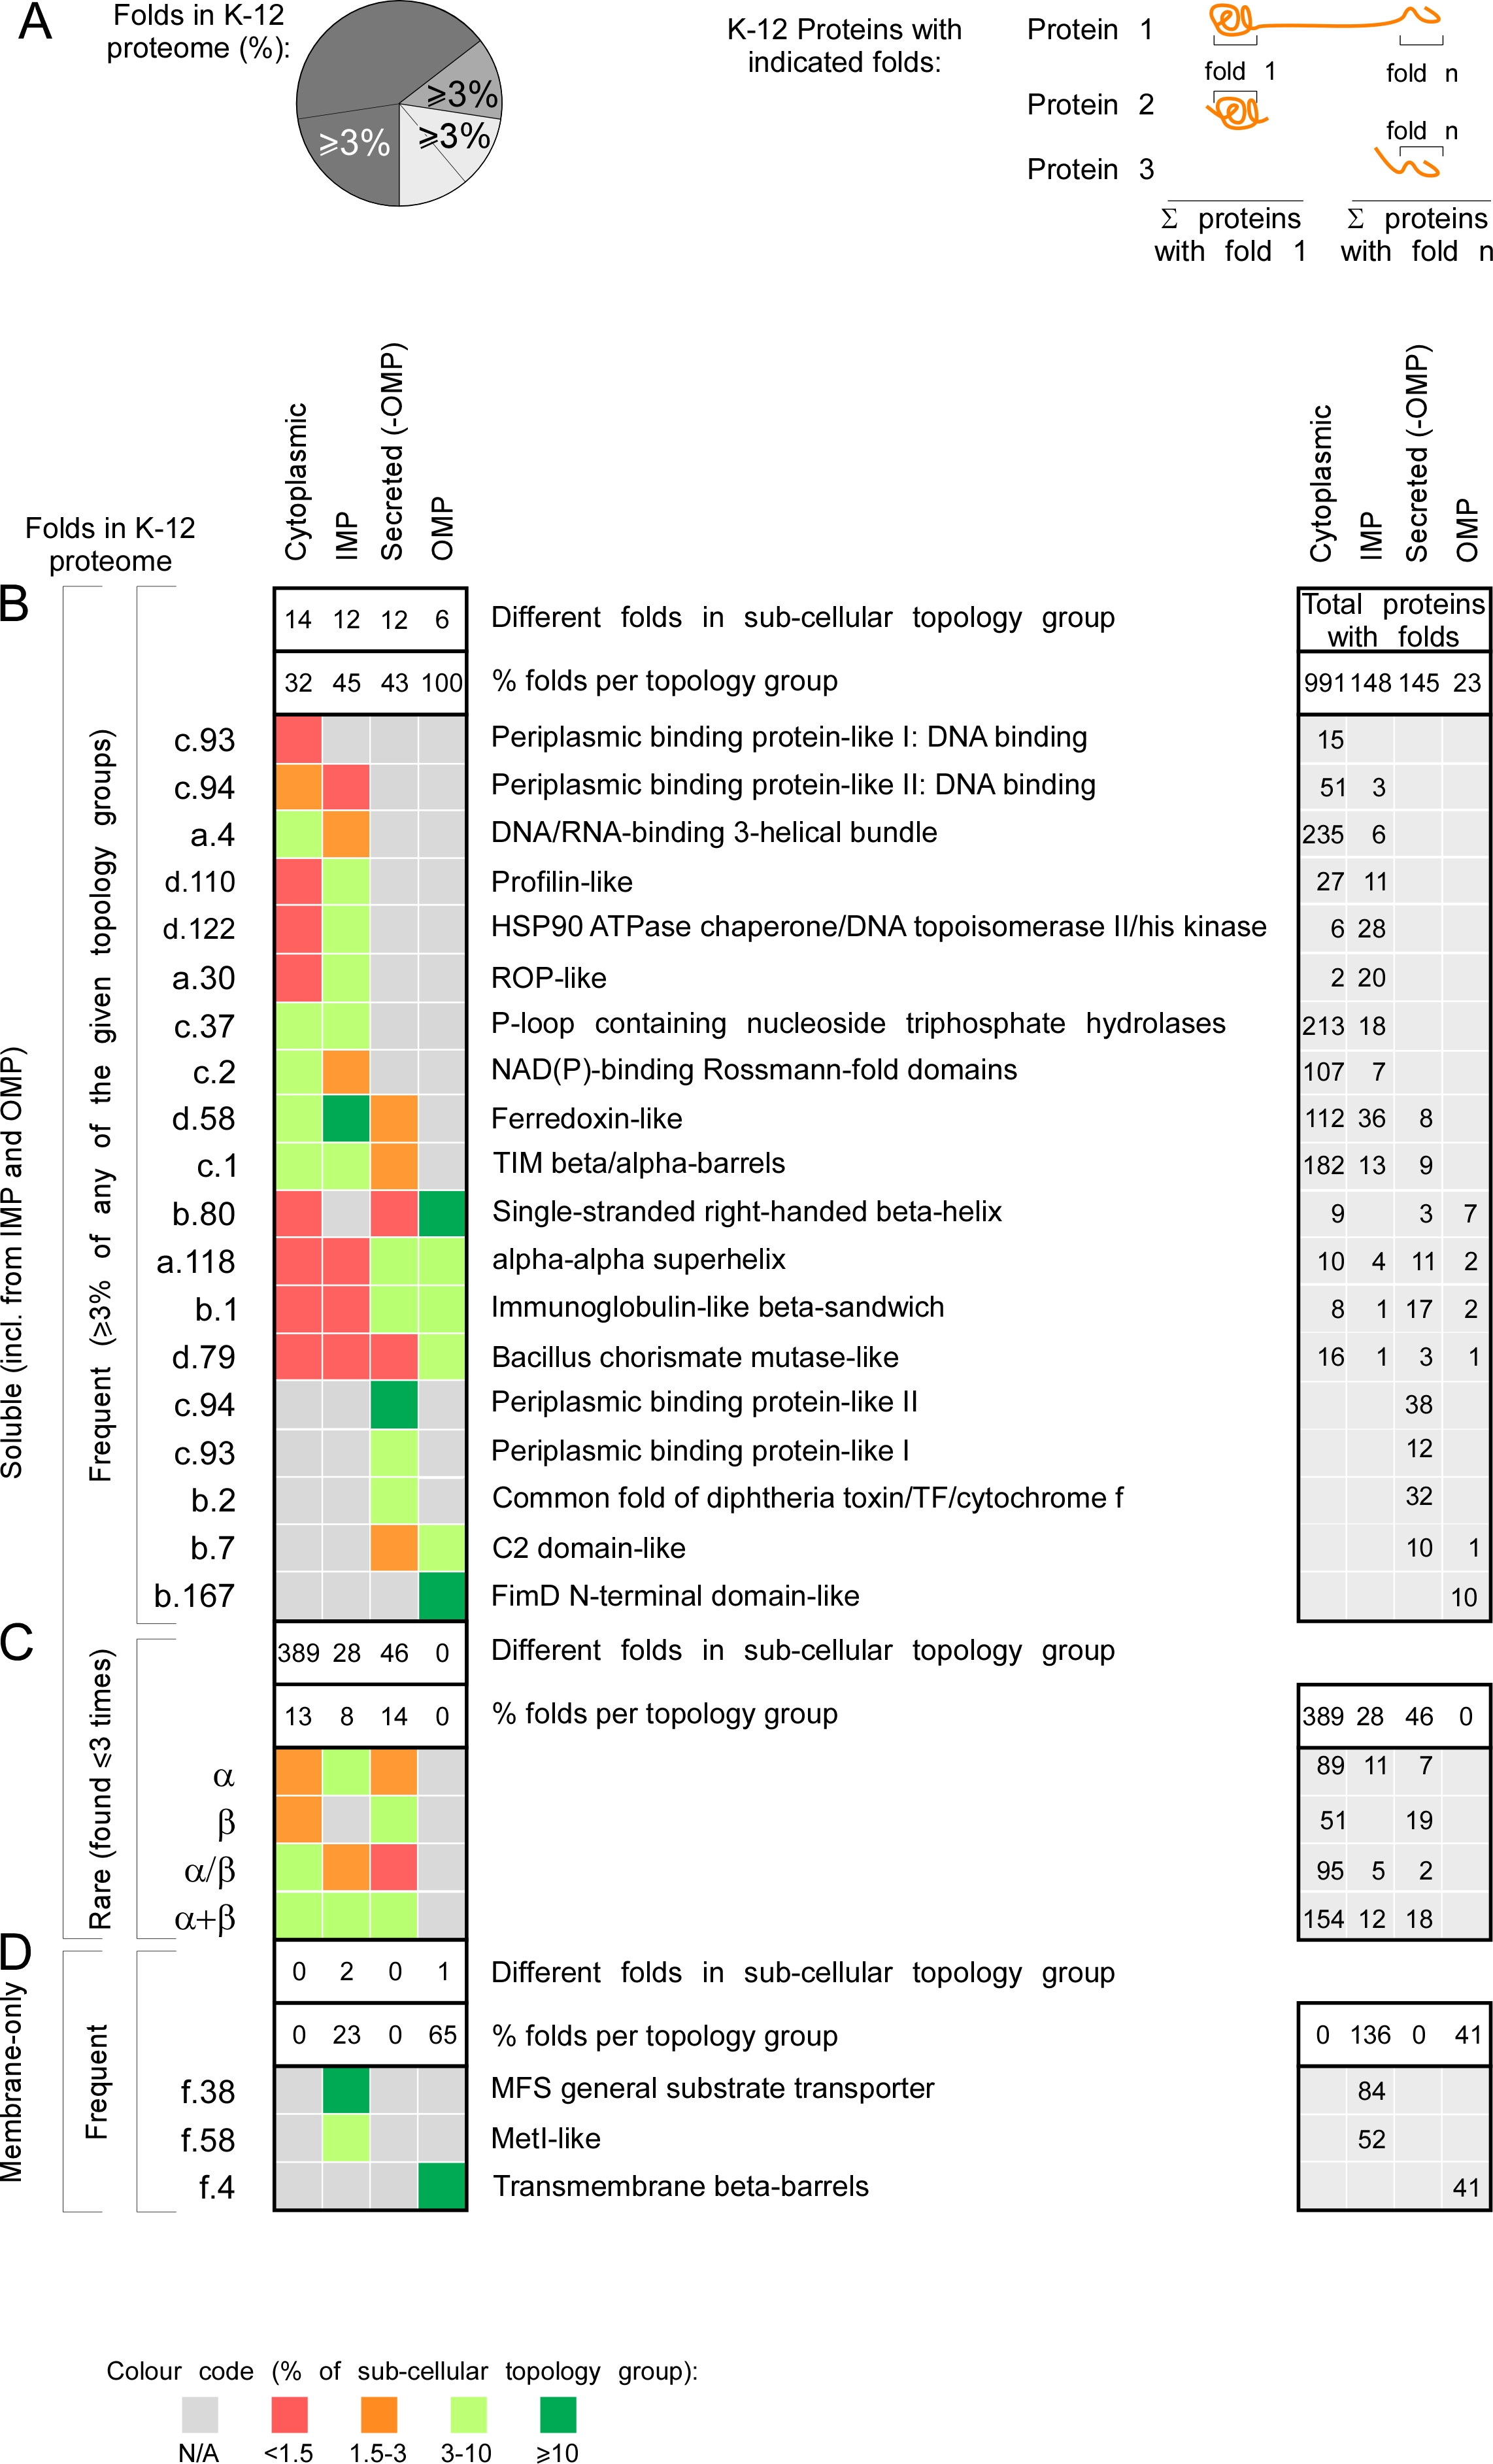
A. Left: cartoon representation of percentages depicted in the heat map (B, C, D on the left). Percentage of folds that represent ≥3% of all the folds found in each topology class (cytoplasmome, IMP, secretome without OMPs or OMPs). Such folds are included in panel B and D. Right: cartoon representation of the numbers depicted in the table on the right. Each number is how many proteins were found having the respective fold. Empty cells when no proteins were found with that fold.
B. 19 soluble folds are shown that each represent ≥3% of folds found in a specific topology group. Left: fold abbreviation; right: full name. On the very right the sum of proteins having each fold is indicated. The absolute number of folds found in each sub-cellular topology group is noted in the upper white box and its corresponding percentage below it in the bottom white box. The upper white box on the right depicts the total protein sum in each topology.
C. The sum of four classes of folds that are rare and their distribution in the topology groups.
D. The membrane folds that represent minimum 3% of folds found in different topology groups.
Abbreviations: IMP = Inner Membrane Proteins; OMP = Outer Membrane Proteins; N/A = none found.
Foldome data can be found in the downloads section.
For more information: Loos et al., 2019.